Dr. Sam Centanni uses the LifeCanvas pipeline to investigate the neurobiological overlap between stress and predisposition to alcohol abuse, as...

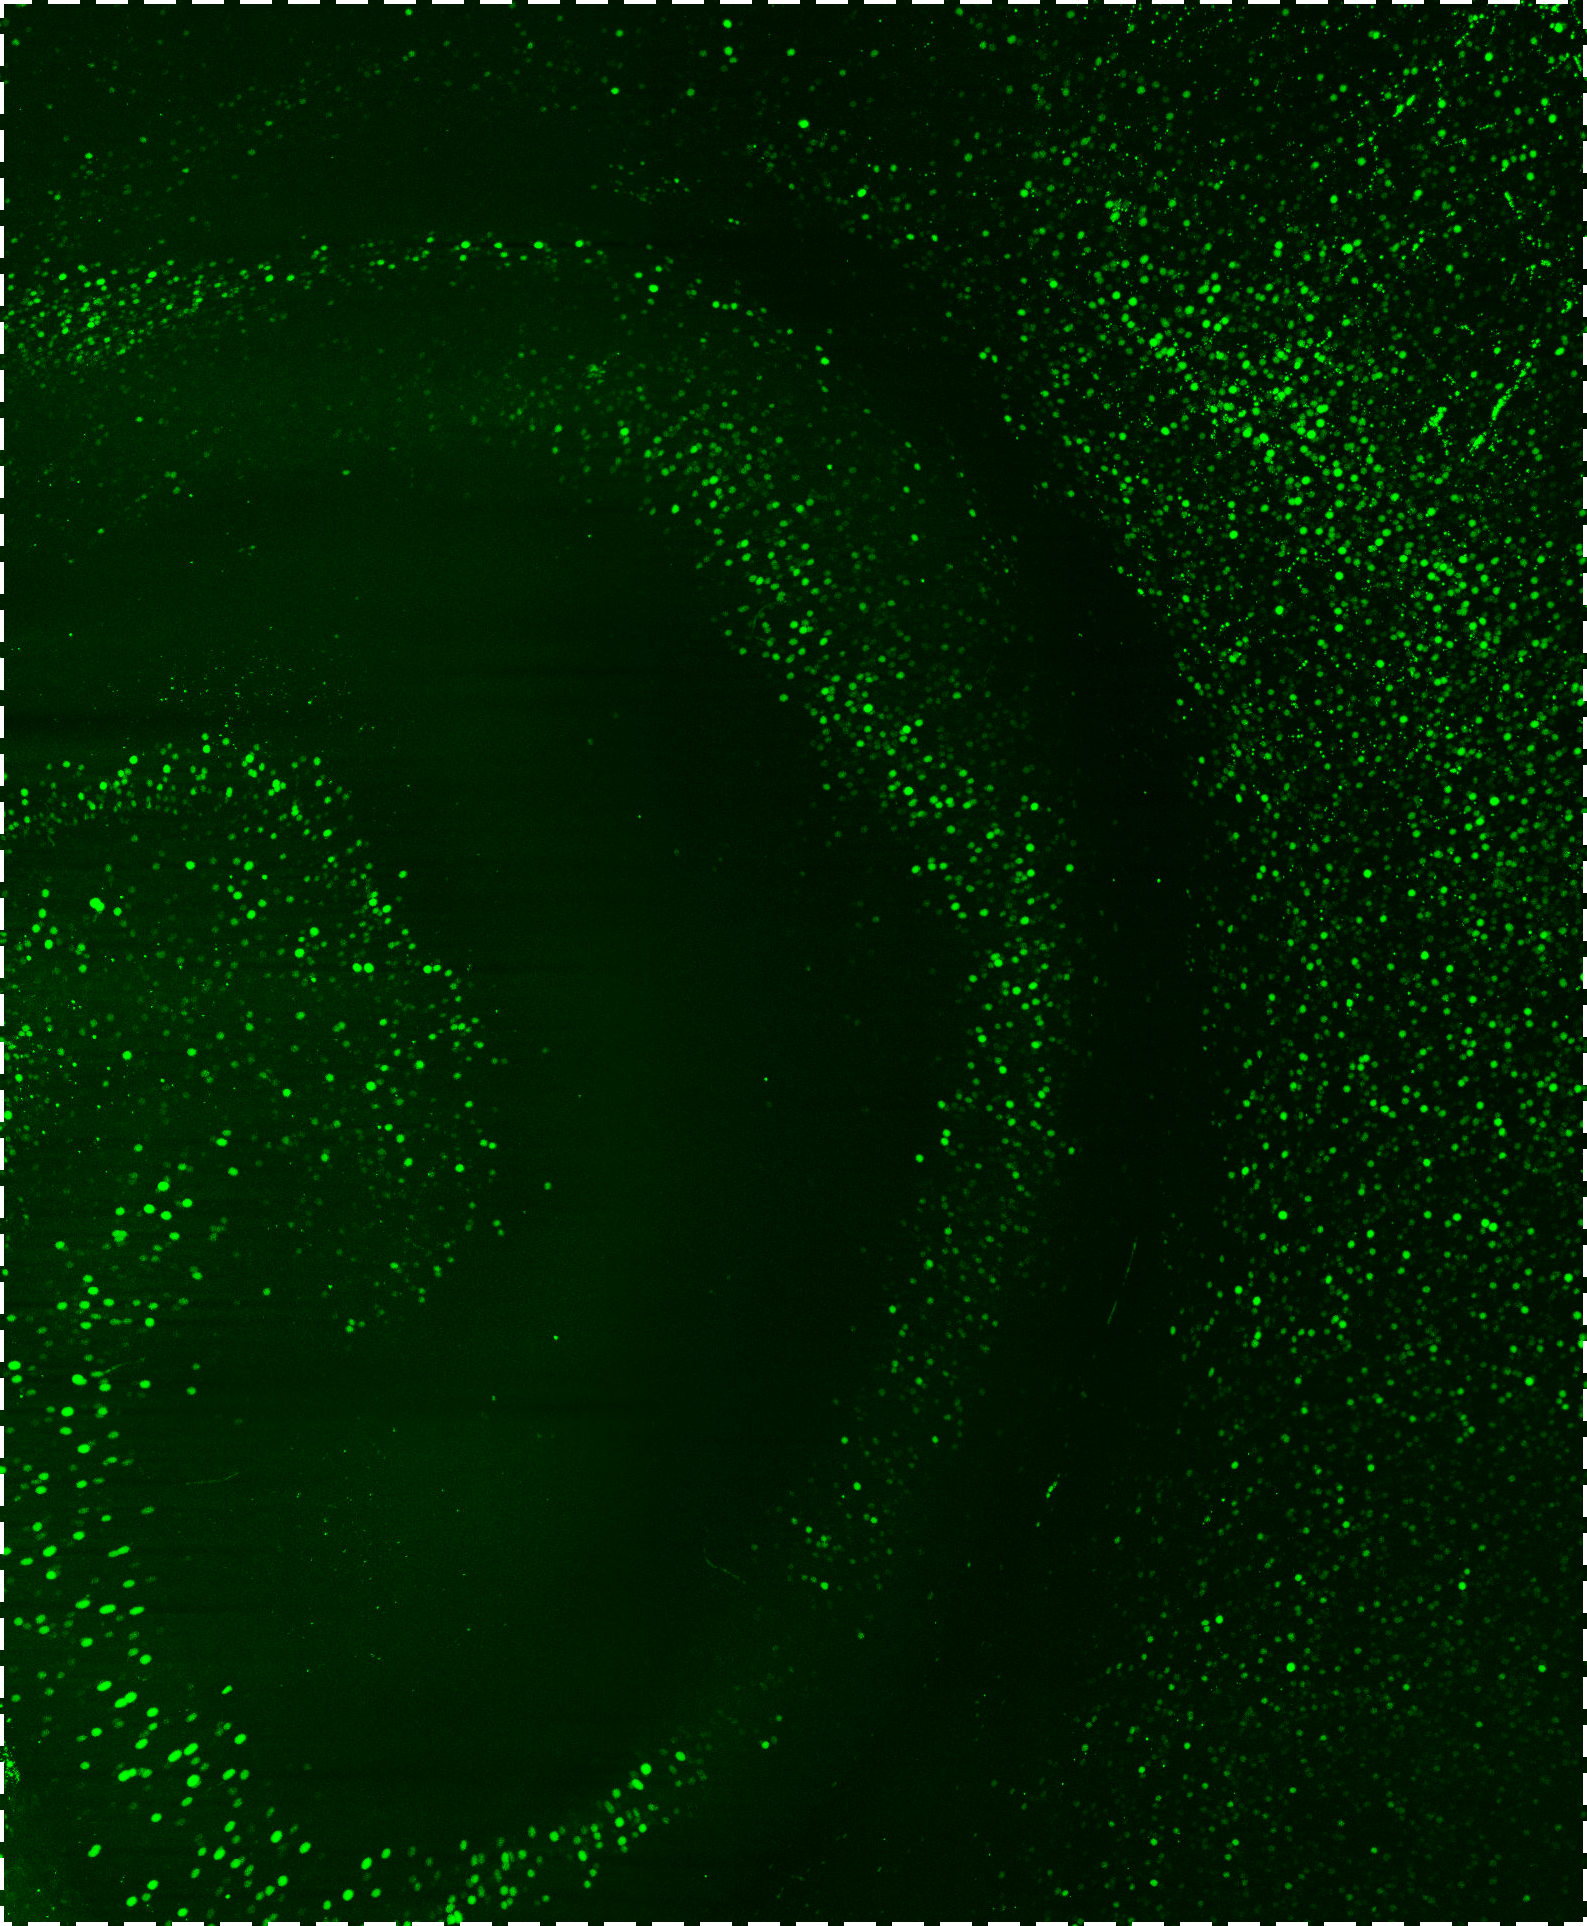
c-FOS is a protein derived from immediate early gene expression and is recognized as a specific marker of neuronal activity throughout the mammalian brain. Through a variety of perturbations (e.g. drug treatments, external stimuli), expression levels become elevated. By detecting c-FOS+ cells throughout tissue volumes via immunolabeling, imaging, and analyses, neural activity can be visualized, mapped, and quantified throughout the brain.
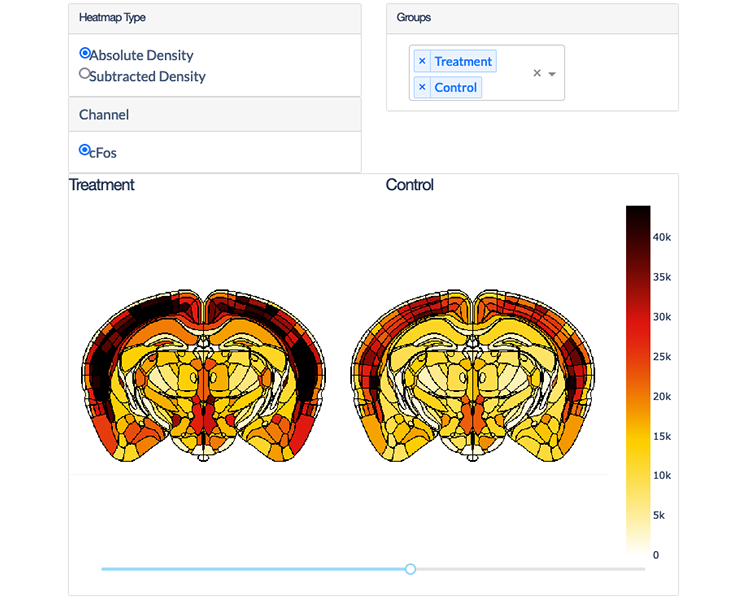
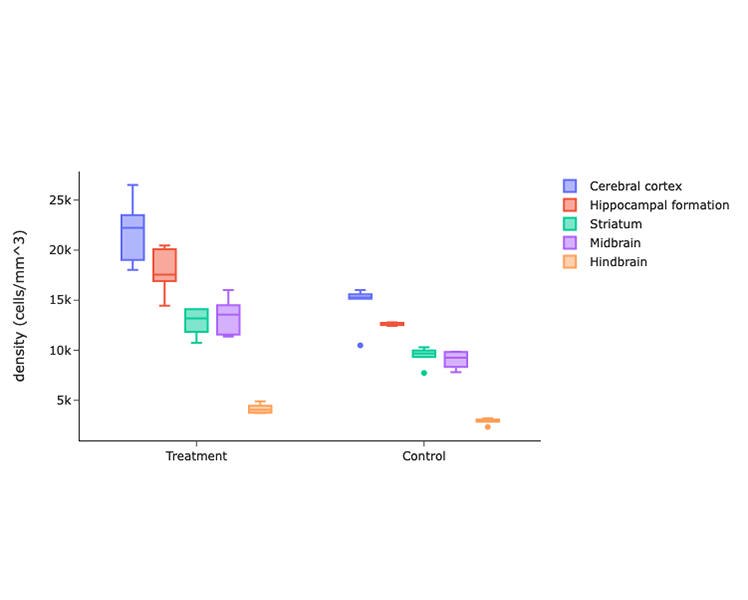
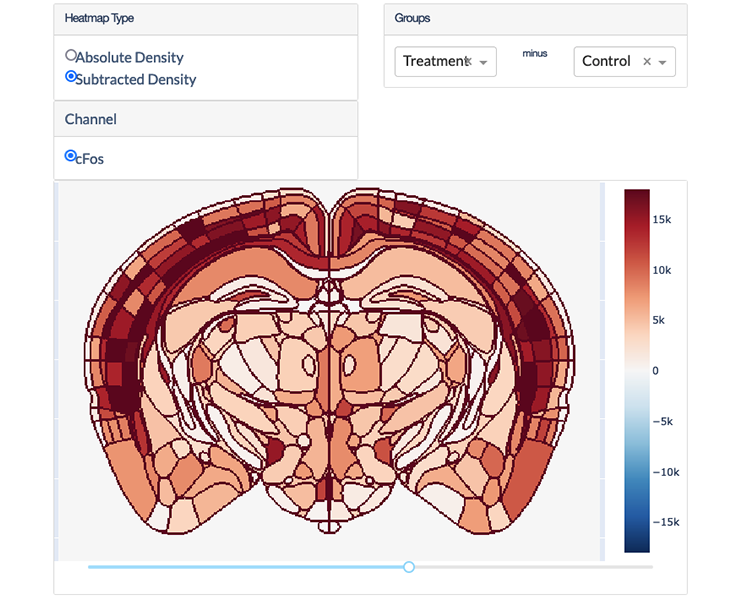
We have fine-tuned our technology to label and image these cells throughout the CNS. We also offer robust models for detecting positive cells in murine brain samples and provide cell counts, densities, and heat maps quantifying levels of regional neural activity registered to the Allen Brain Atlas.
Upon receiving your samples, LifeCanvas technicians:
You send us: PFA-fixed samples from your experimental animals
Through our interactive data delivery platform, we provide:

Dr. Sam Centanni uses the LifeCanvas pipeline to investigate the neurobiological overlap between stress and predisposition to alcohol abuse, as...
Ph.D. candidate Kaitlyn Dorst uses LifeCanvas CRO services to investigate the underpinnings of fear memories in mice.
Dr. Rafael Perez leverages LifeCanvas CRO services to study the neurological effects of environmental context on opioid tolerance.
Dr. Emily Newman uses LifeCanvas' c-FOS mapping services to study the underpinnings of aggressive behavior in female mice.
For technical support reach out to our dedicated customer support team at support@lifecanvastech.com.