c-FOS: Molecular biology & detection for analysis of neuronal activity

Although in the realm of neuroscience c-FOS protein is typically recognized as a marker of neuronal activity, it was originally discovered nearly forty years ago in rat fibroblasts (Curran and Teich, J. Virology, 1982) and characterized as being encoded by a proto-oncogene (a gene that once mutated can become tumor-inducing) and is overexpressed in a number of cancers. c-FOS functions as a transcription factor and its primary role is in the nucleus to regulate genes that are switched on or repressed depending on influences from external stimuli.

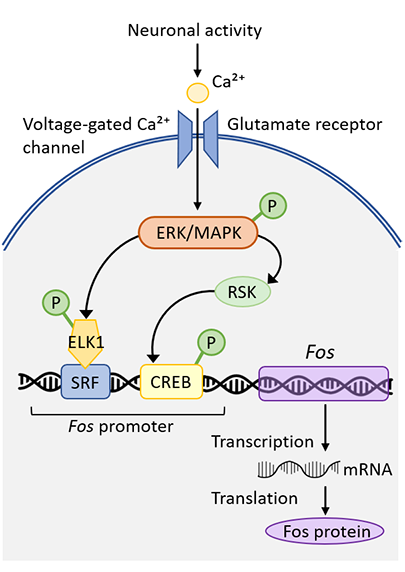
Indeed, c-FOS “bridges the gap” by mediating the conversion of extracellular signals into changes in gene expression. For instance, as depicted in Figure 1, extracellular triggers like the excitatory neurotransmitter glutamate or openers of voltage-gated calcium channels can generate an intracellular cascade that, via activation of kinases, results in the phosphorylation and binding of phospho-ELK1 and phospo-CREB to fos gene promoter regions that drive up-regulation of c-FOS protein levels. Due to the rapid increase in levels and early response of this proto-oncogene, c-fos has been dubbed an ‘immediate early gene’ as an early responder to various cellular perturbations including electrical stimulation, exposure to serum, growth factors, and neurotransmitters.

Figure 1: Upregulation of c-FOS through neuronal stimulation. Neuronal excitation drives an increase in intracellular Ca2+ concentrations through opening of voltage-gated channels or ligand-gating of excitatory receptors. In turn kinases (ERK/MAPK pathway) are activated that phosphorylate transcription factors (ELK1 and CREB) to drive up-regulation of c-FOS expression via the fos promoter.

Once nuclear c-FOS levels are elevated, in turn it dimerizes with other members of the Fos family of transcription factors, for instance c-JUN (Figure 2). c-FOS & c-JUN heterodimerize via interactions of leucine residues that are periodically presented along the α-helical regions of both homologous proteins, forming a ‘leucine zipper’ resulting in formation of Activator Protein 1 (AP-1) complex. Both N-termini are composed of basic amino acids and bind at AP-1 palindromic sites within the major groove of DNA to enhance and promote the expression of downstream target genes. In this way, these bZIP (‘basic-region leucine zipper’) transcription factors control a cascade of cellular events in response to immediate changes of the environment leading to longer term changes in cellular activity.

Figure 2: Heterodimerization of c-FOS/c-JUN. α-helical regions of c-FOS and c-JUN dimerize via a ‘leucine zipper’, and the complex binds to DNA to promote a subsequent cascade of targeted gene expression.

So what of c-FOS’s role as a key marker of neuronal activity in neuroscience? On account of its robust and immediate elevation upon neuronal stimulation, researchers have exploited the up-regulation of c-FOS to serve as a key indicator of neuronal responses to various triggers including specific behaviors, peripheral stimulation and drug exposure. For instance, neurons of the suprachiasmatic nucleus of the hypothalamus, the master mammalian circadian clock, exhibit rhythmic activity and neuronal firing, and therefore also cycles of c-FOS expression that rise and fall over a ~24-hr period (Earnest and Olschowka, J. Biological Rhythms, 1993).

The somatosensory input from rodent whiskers has also been extensively studied where patterns of elevated c-FOS expression are revealed in neurons of the barrel cortex when the whiskers are peripherally stimulated (Filipkowski et al., Learning & Memory, 2000, Figure 3). Indeed this research determined that the organization of cortical function is based around topographical principles whereby columns of neurons (“barrels”) respond selectively to input from one or other whisker. Finally, anti-psychotic treatments can induce robust and long-lasting change in c-FOS throughout the cortex and striatum (Kontkanen et al., Neuropsychopharm., 2002), highlighting how researchers can use its expression levels to assess and track localized regions of drug action.

Figure 3: Whisker stimulation maps to localized c-FOS expression in the rodent barrel cortex. The schematic depicts the sequential brushing of each whisker which in turn activates groups of neurons in specific “barrels” within the rodent somatosensory cortex, identified via an up-regulation in c-FOS expression (indicated by the light blue, orange and green barrels).

Thus, the detection and analysis of c-FOS expression has resulted in seminal studies in neuroscience. To this end, LifeCanvas has now further developed its technologies to enable uniform labeling of c-FOS protein throughout whole tissues. These crucial developments will support neuroscientists in a broad range of investigations including disease- and age-related changes in neural responses to external stimuli, studies of learning and memory, detecting brain tumors and tracking neurogenesis throughout 3D brain volumes.

LifeCanvas has a platform for the detection and quantification of c-FOS expression across entire brain volumes using active immunostaining and light-sheet imaging of cleared, SHIELD-preserved samples (Figure 4). Once imaged, cell locations are detected with a convolutional neural network and mapped to brain regions by registering the imaged brain with the Allen Brain Reference Atlas. This enables rapid quantification of a per-area activity map across the entire mouse brain. The combination of basic knowledge and research on the role of c-FOS alongside cutting-edge technologies developed at LifeCanvas will continue to drive the groundbreaking neuroscience discoveries of the future.

Figure 4: Localization of c-FOS expression in the murine brain. Left: An image stack captures the hippocampus and cortex in the sagittal plane of a mouse brain left hemisphere stained with anti-c-FOS. These images were acquired with SmartSPIM at 3.6X magnification and 4 µm z-step. Scale bar 500 µm. Middle: Heatmap of cell density by region in mouse brain hemisphere stained with anti-c-FOS, generated with SmartAnalytics. Right: Histogram of cell density by region in the same c-FOS stained hemisphere, generated by SmartAnalytics.

More posts