
Mapping the localization of increased c-FOS expression provides important insights into specific brain regions implicated in the responses to a range of stimuli. Researchers have used c-FOS protein up-regulation as an indicator for a variety of cellular activities. For instance, this marker is a useful proxy for measuring the mammalian response to various stimuli including behavioral changes, pain, pharmacological manipulation, and genetic modification as generalized neuronal stimulation leads to an immediate, marked increase in c-FOS.
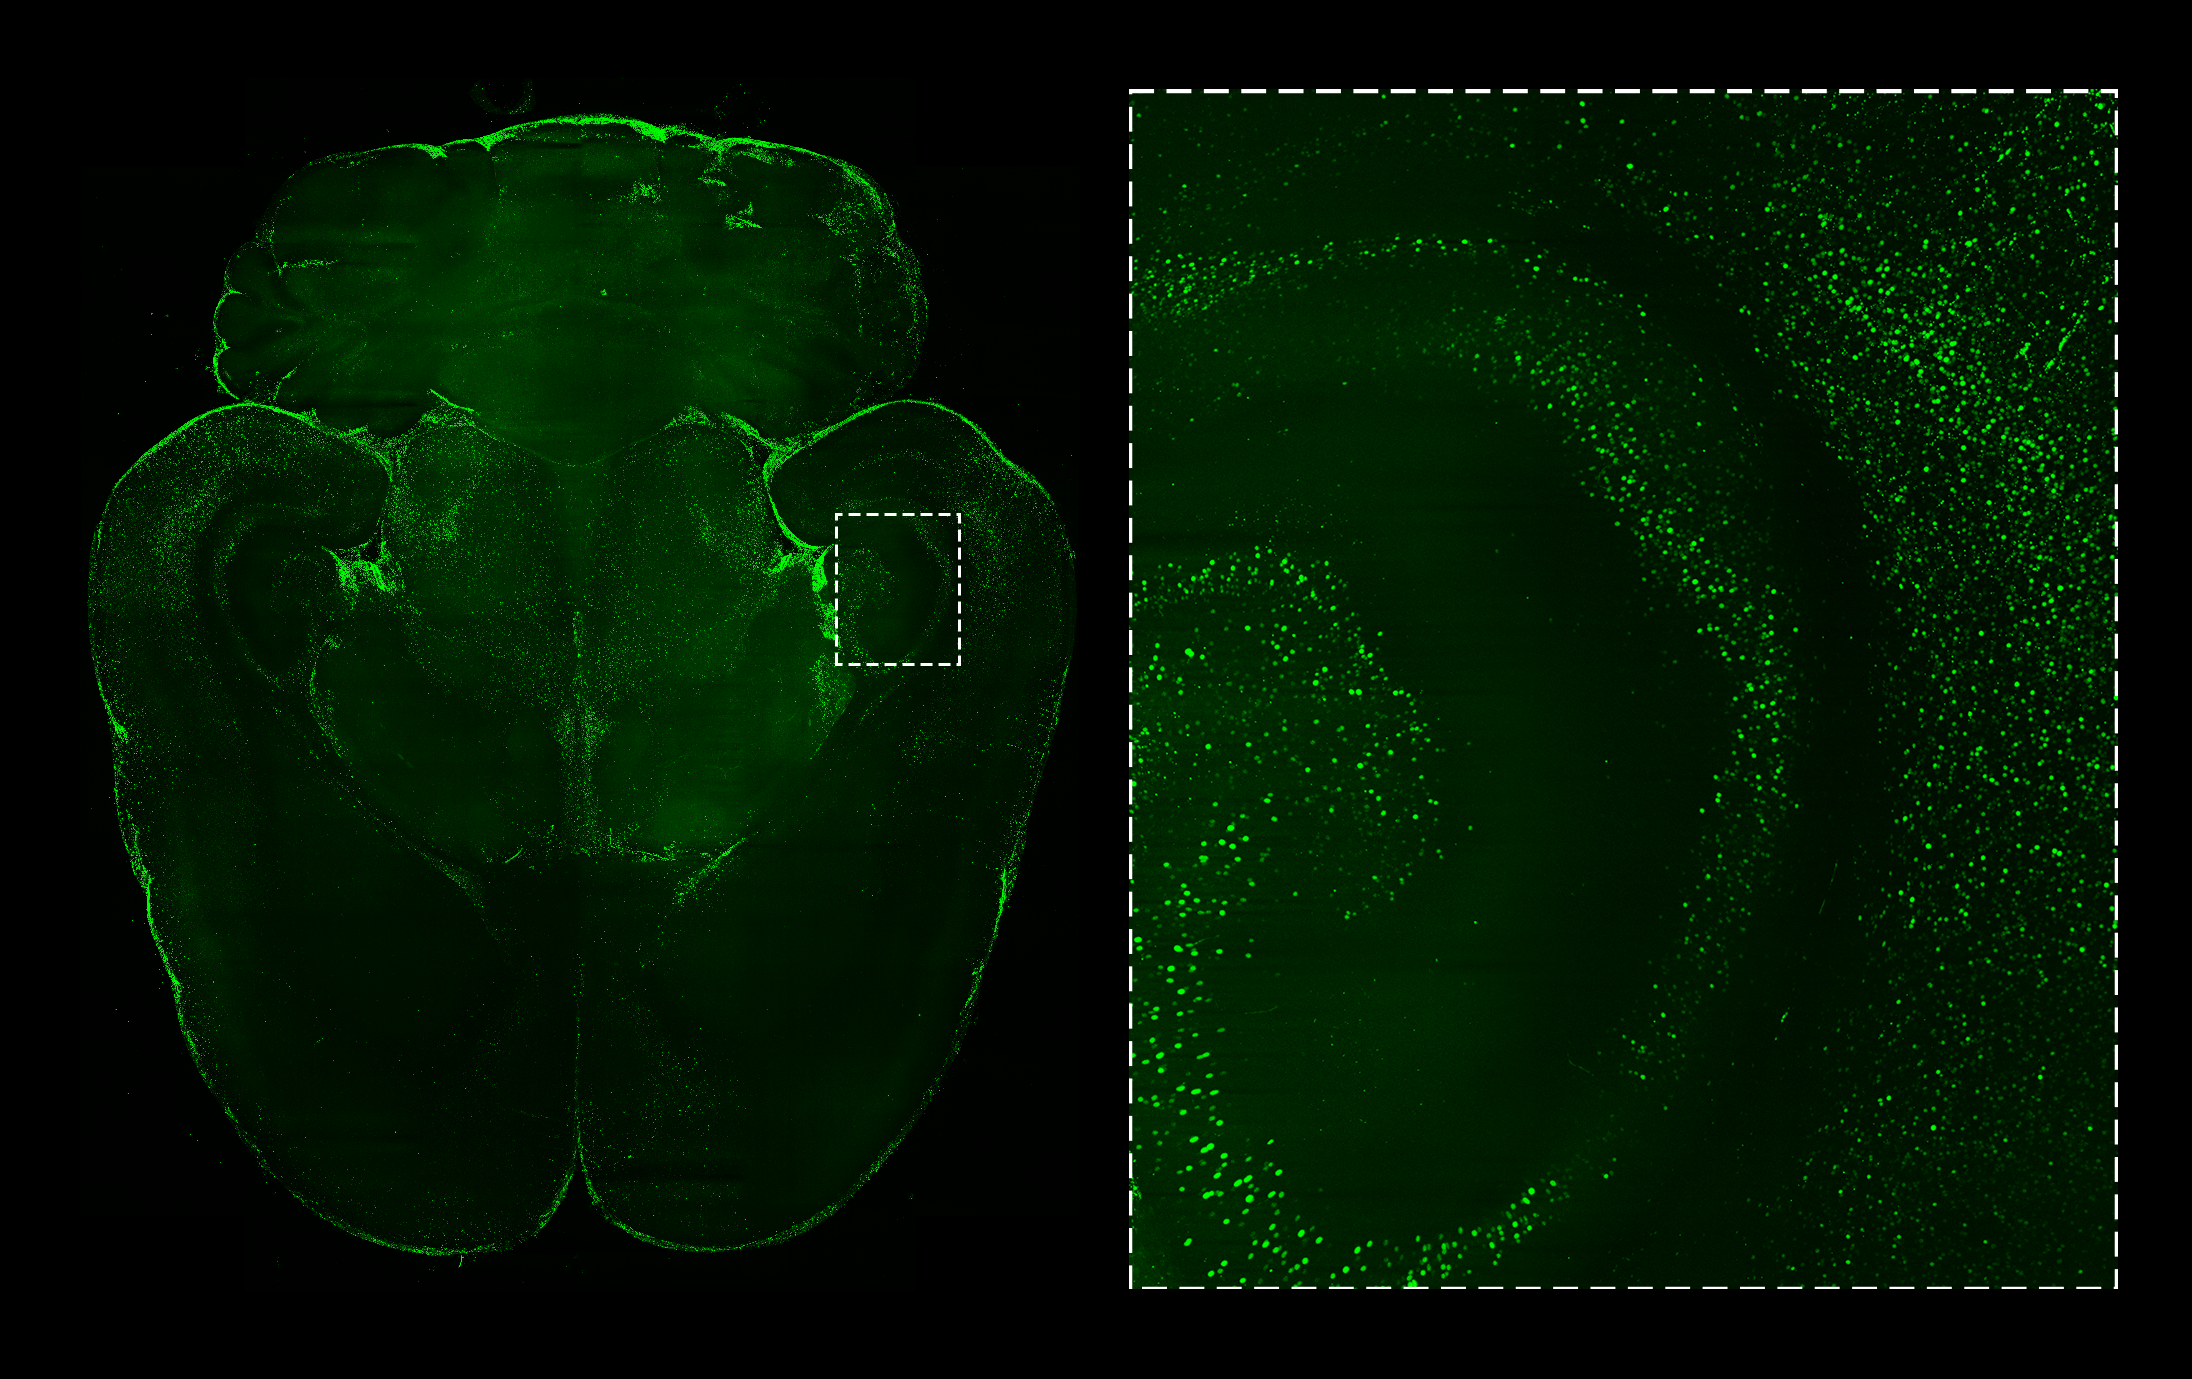
c-FOS (green) in rat brain, with zoomed in region. Click to download full resolution.
What makes working with c-FOS challenging?
Tissue processing and imaging methods can make a vast difference to the quality and reliability of c-FOS expression data. Preparing histological thin sections and using 2D imaging techniques can impact the accuracy of spatial and quantitative changes in c-FOS levels throughout a sample volume. For instance, data gathered from selected sections may misrepresent the distribution and topology of expressing cells. Additionally, collating 2D data towards generating a more holistic view is laborious and error-prone.
How can LifeCanvas tools help overcome these limitations?
High-throughput intact tissue processing can resolve issues related to standardization, sample variation, and researcher bias. LifeCanvas’ SmartBatch+ quickly and thoroughly clears and immunolabels up to 12 whole mouse brains or 4 whole rat brains, providing rapid processing and unmatched experimental consistency.
"End-to-end sample processing, expert support, and informative 3D data drive scientific advancement."
LifeCanvas also has validated a portfolio of antibodies for use in uniform immunolabeling of large sample volumes – including antibodies for c-FOS, ARC, and ΔFosB, thereby saving investigators the time and labor involved in optimizing protocols.
The SmartSPIM lightsheet microscope can acquire the image data from fluorescently-tagged c-FOS+ cells throughout a whole mouse brain in ~40 mins at (1.8 x 1.8 x 4 micron resolution). Furthermore LifeCanvas’ robust analysis software SmartAnalytics enables registration of image data to the Allen Brain Atlas, c-FOS+ cell detection, and generation of analysis outputs including regional cell counts/densities, heatmaps and coronal views of the image data with Atlas overlay.
Uniform cFOS+ staining throughout whole murine brain. Imaged with SmartSPIM at 1.8 µm XY pixel size and 4 µm z-step.
Why use LifeCanvas CRO instead of in-house resources?
Alongside access to innovative 3D histology, light sheet microscopy, and analysis tools, LifeCanvas’ CRO services provide access to technicians and scientists highly experienced in conducting c-FOS-related research projects. The LifeCanvas workflow is optimized to minimize sample handling and maximize the precision of delivered results. End-to-end sample processing, expert support, and informative 3D data drive scientific advancement.
Innovative applications of whole brain c-FOS mapping can reveal exciting insights into behavioral states and drug discovery. Most recently, Davoudian et al. (bioRxiv, March 2022) utilized LifeCanvas’ CRO services to explore the impacts of psychedelic compounds on immediate early gene expression and neural plasticity – a topic at the forefront of psychiatric research. Whole brain mapping allowed the researchers to detect ketamine- and psilocybin-induced differences in c-FOS expression across brain regions.