LifeCanvas provides exceptional-qualitywhole organ mapping services to meet and surpass your research goals. Our team has extensive expertise in tissue processing and imaging, as well as robust image analysis methods for complex, information-rich datasets. Just send us your PFA-fixed samples, and we’ll do the rest.
Pictured above: Mouse brain hemisphere with ChAT+ (magenta) neurons in brainstem and basal forebrain, with dense labeling of NPY (cyan) throughout hypothalamus. Tissue courtesy of Dr. Hongwei Dong, Center for Integrative Connectomics (CIC), USC.
Our interactivedata delivery platform presents your data in an easily digestible and customizable format. View the experimental effect on multiple brain regions in side-by-side bar plots, and compare treatment groups with subtracted heatmaps.
We deliver:
Regional cell counts registered to the Allen Brain Atlas
Heat maps showing localized levels of protein expression
Coronal views with Atlas overlays depicting labeled cells throughout the whole brain volume
Leverage our complete pipeline to achieve your aims
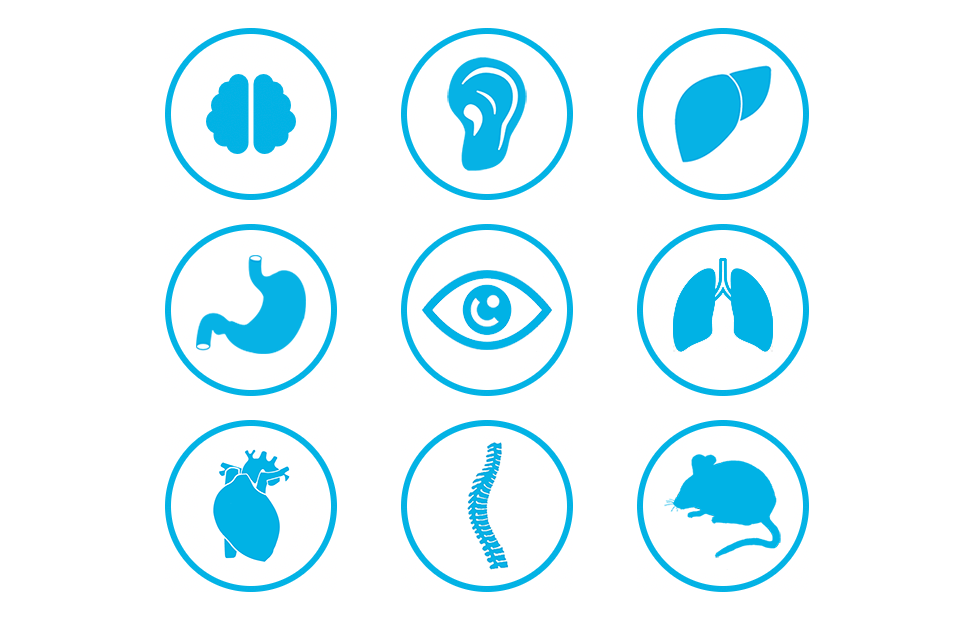
We clear and image intact samples with endogenous fluorescent reporters (e.g. GFP, YFP, RFPs) tagging select cells and processes. Our tools preserve fluorescent proteins exceptionally well, and work with a variety of tissue and sample types, including: spinal cord, kidney, liver, heart, lung, intestine, organoids, and tumors.
We have perfected technology to label and image c-FOS+ cells throughout the CNS. Using our robust models for detecting c-FOS+ cells in mouse brains, we provide: cell counts, densities, and heat maps quantifying levels of regional neural activity registered to the Allen Brain Atlas.
We process and analyze samples for β-amyloid deposition in Alzheimer’s disease models, and for accumulation of α-synuclein in Lewy Bodies in Parkinson’s disease models. We determine levels of protein aggregation for regionally specific brain areas registered to the Allen Brain Atlas.
Our versatile technologies allow us to label multiple targets, including specific cell types (e.g. neurons, glia), nuclei, and vasculature. We can also process multiple organ or sample types using tissue-specific markers.