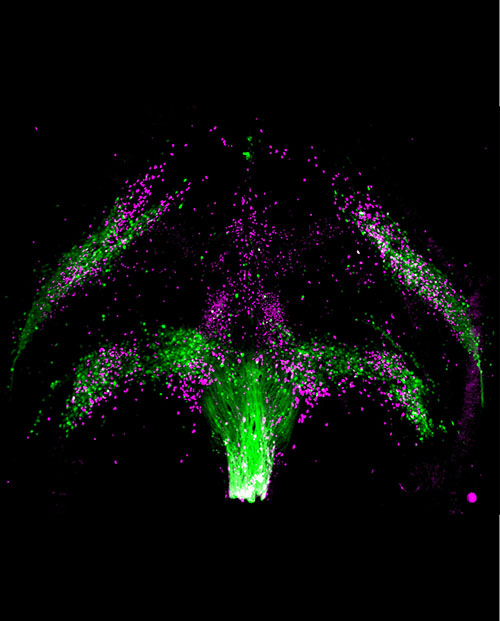
Dr. Kim’s lab recently published “Whole-Brain Wiring Diagram of Oxytocin System in Adult Mice” in The Journal of Neuroscience.
LifeCanvas (LC): How did you become interested in whole brain mapping?
Yongsoo Kim (YK): I wanted to understand the cellular context of molecular interactions – magic happens between the synapses and the cells. But scientists, including myself, can often become obsessed with small details and lose context. Even with tiny computations happening at the local circuit level, the brain works as a global network. So I became interested in seeing the whole picture with cellular resolution detail.

LC: How have new tools and innovations in the field influenced your research?
YK: As a postdoc in the Cold Spring Harbor Laboratory, I was working with an imaging technique called serial 2-photon tomography to map out oxytocin neurons. This requires endogenous fluorophores, such as those found in transgenic reporter mice. Transgenic mice often have the issue of generating false positive and false negative detection results, so I also needed an independent validation method to confirm my observations. Additionally, serial 2-photon tomography requires brain sectioning; my current work focuses on developing mouse brains, which are very fragile and cannot be sliced without significant damage.

LifeCanvas’ advanced tissue clearing, immunolabeling, and whole brain imaging techniques gave me a lot more freedom in my experimental design, as well as a method of independently validating initial results. I could use whole brains from non-fluorescing mice, as well as non-standard model species. This was a technical breakthrough. With rapidly acquired, high resolution volumetric images of developing mouse brains, we could effectively map early developmental stages.
LC: Why did you choose to focus on oxytocin neurons?
YK: I became a neuroscientist because of my interest in autism. When I was an undergraduate, I volunteered in an institute where individuals with various conditions were learning to develop their social skills. By interacting with autistic individuals, I became interested in how the human mind perceives social stimuli and generates socially appropriate responses.
Oxytocin is known to be integral to the promotion of social behaviors. It also does a lot of different things, such as modulating appetite, anxiety, and pain. How does this very small molecule achieve so many functions? I believe that connections specific to certain brain regions give rise to different circuits which process motor, sensory, and emotional information.
To understand these circuits, we need to create maps of wiring diagrams throughout the whole brain. Our recent publication discusses how oxytocin is structured in the neurotypical brain – the next step is to compare this to the organization of oxytocin neurons in a mouse model of social impairment.

LC: What led you to creating atlases of the developing brain, and how will this help our understanding of social behavior and its dysfunction?
"By broadly scanning developmental events at single-cell resolution across the whole brain, we can find which brain areas ... may be participating in the development of circuits that facilitate social learning."
YK: For decades, neuroscientists have typically sectioned the brain, looked at an area of interest, and used various 2D atlases to identify the anatomy of that area. 3D reference brains have only very recently become available in adult mice. This allows for target markers – neuronal and otherwise – to be mapped onto a common 3D space, giving scientists a key tool to compare data from many different studies. We don’t have a similar framework for the developing mouse brain.
By broadly scanning developmental events at single-cell resolution across the whole brain, we can find which brain areas – including previously unsuspected ones – may be participating in the development of circuits that facilitate social learning. A 3D developmental brain atlas would then allow for holistic comparison across time points. I have hope that this will be an infrastructural innovation, propelling neuroscientists towards understanding how brains develop and change in the context of neurodevelopmental disorders. LifeCanvas’ tools play a pivotal role in generating these high resolution 3D atlases.
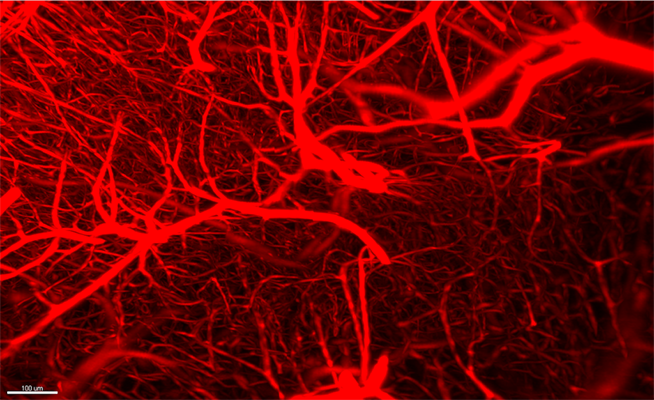
LC: Your lab also studies neurovasculature. How does this relate to your other research?
YK: Vasculature is critical because the brain is the most energy-consuming organ in the body, and unlike muscle, it does not have energy reservoirs. When blood stops flowing, the brain is in trouble. Nevertheless, we don’t pay much attention to the brain-energy axis.
Leading hypotheses in the field of aging and neurodegeneration propose that vasculature is potentially affected first, subsequently leading to energy deficits and neuronal death. I put aging in the same axis as neurodevelopment: they are both associated with the variable of time.

My lab is interested in how different cell types are generated and maintained, and how they eventually stop working. So far, our efforts have focused on establishing both ends of this axis independently. But now we are in a position to combine investigation of vasculature with neurodevelopment, and consequently how the oxytocin system changes with aging. We are also actively using LifeCanvas tools to look at how vasculature interacts with neurons in the context of aging.
LC: What are your future plans with brain mapping and other tools in development?
YK: The last piece of the puzzle is glia, which consist of 3 major cell subtypes: astrocytes, microglia, and oligodendrocytes. After mapping glial populations in the whole brain, I plan to align all of the information into one 3D atlas and calculate the composition of different cell types across brain regions. Then I plan to see how this map develops and changes upon aging, as well as in the context of disease. To put it simply, I am interested in generating a comprehensive theory to explain the brain’s inner workings in the context of cell types and their interactions. It may be grandiose, but we’re scientists! So let’s dream big.

