Citing LifeCanvas Products
This page is meant to provide some guidance and example text / images for the Methods section of your manuscripts. Please feel free to copy, edit, and use them for any purpose!
TISSUE PRESERVATION & CLEARING, IMMUNOLABELING, AND IMAGING EXAMPLE TEXT
Paraformaldehyde-fixed samples were preserved with using SHIELD reagents (LifeCanvas Technologies) using the manufacturer’s instructions (Park et al., 2018) . Samples were delipidated using LifeCanvas Technologies Clear+ delipidation reagents. Following delipidation samples were labeled using eFLASH (Yun et al., 2019) technology which integrates stochastic electrotransport (Kim et al., 2015) and SWITCH (Murray et al., 2015), using a SmartBatch+ (or SmartLabel) device (LifeCanvas Technologies). After immunolabeling, samples were incubated in 50% EasyIndex (RI = 1.52, LifeCanvas Technologies) overnight at 37°C followed by 1 d incubation in 100% EasyIndex for refractive index matching. Samples were mounted in 2% ultra-low melt agarose made with EasyIndex, and reincubated overnight in EasyIndex. After index matching the samples were imaged using a SmartSPIM axially-swept light sheet microscope using a 3.6x objective (0.2 NA) (LifeCanvas Technologies).
If you added additional decalcification or fDisco steps for clearing heterogeneous tissue types, please add them to the description and cite the paper below by Nudell at al., 2022.
PUBLICATIONS
SMARTANALYTICS IMAGE ANALYSIS EXAMPLE TEXT
Atlas Registration (NeuN)
Samples were registered to the Allen Brain Atlas (Allen Institute: https://portal.brain-map.org/) using an automated process using SmartAnalytics (LifeCanvas Technologies). A NeuN channel for each brain was registered to an average NeuN atlas (generated by LCT using previously-registered samples). Registration was performed using successive rigid, affine, and b-spline warping algorithms (SimpleElastix: https://simpleelastix.github.io/).
Atlas Registration (Autofluorescence)
Samples were registered to the Allen Brain Atlas (Allen Institute: https://portal.brain-map.org/) using SmartAnalytics (LifeCanvas Technologies). An autofluorescence channel for each brain was registered to an average autofluorescence atlas (generated by LCT using previously-registered samples). Registration was performed using successive rigid, affine, and b-spline warping algorithms (SimpleElastix: https://simpleelastix.github.io/).
Cell Detection
Automated cell detection was performed using SmartAnalytics (LifeCanvas Technologies) using a custom convolutional neural network created with the Tensorflow python package (Google). The cell detection was performed by two networks in sequence. First, a fully-convolutional detection network (https://arxiv.org/abs/1605.06211v1) based on a U-Net architecture (https://arxiv.org/abs/1505.04597v1) was used to find possible positive locations. Second, a convolutional network using a ResNet architecture (https://arxiv.org/abs/1512.03385v1) was used to classify each location as positive or negative. Using the previously-calculated Atlas Registration, each cell location was projected onto the Allen Brain Atlas in order to count the number of cells for each atlas-defined region.
Segmentation
Beta amyloid segmentation was performed using SmartAnalytics (LifeCanvas Technologies) using a custom convolutional neural network created with the Tensorflow python package (Google). The network was based on U-Net (https://arxiv.org/abs/1505.04597v1) and Fully Convolutional Network (https://arxiv.org/abs/1605.06211v1) architectures to perform a semantic segmentation task. The network outputs a probability map for each 3-d input, representing the likelihood that each voxel is part of a beta-amyloid plaque. The probabilities were then thresholded to yield a 3-d mask of the same size as the initial image, where positive values indicated detected plaques. Using the previously-calculated Atlas Registration, each plaque location was projected onto the Allen Brain Atlas in order to calculate the plaque coverage for each brain region.
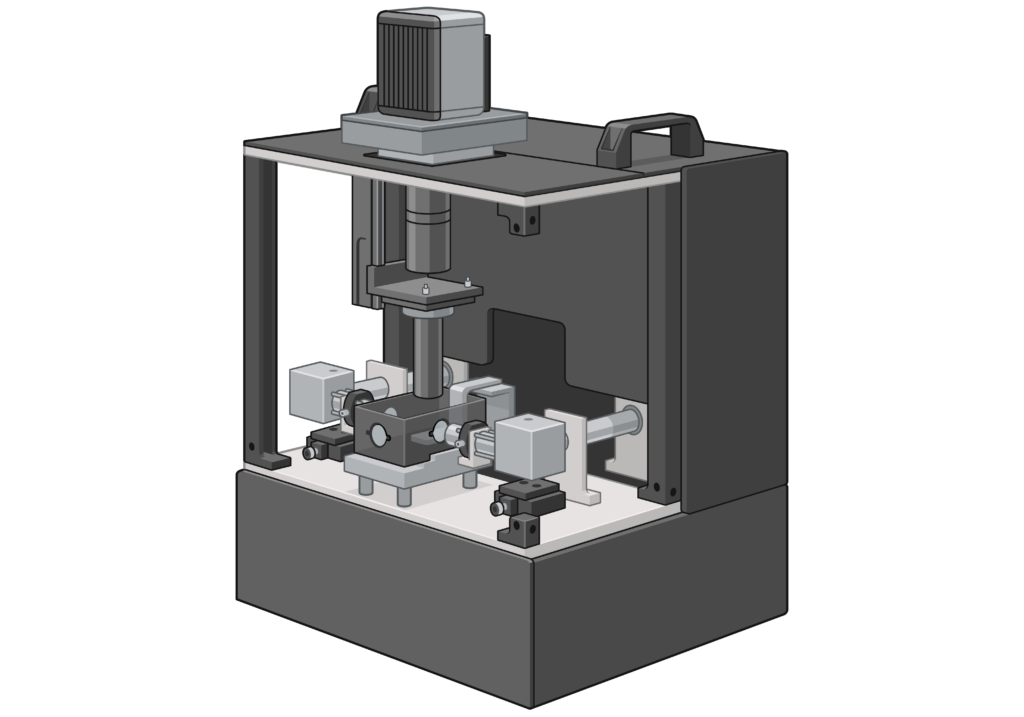
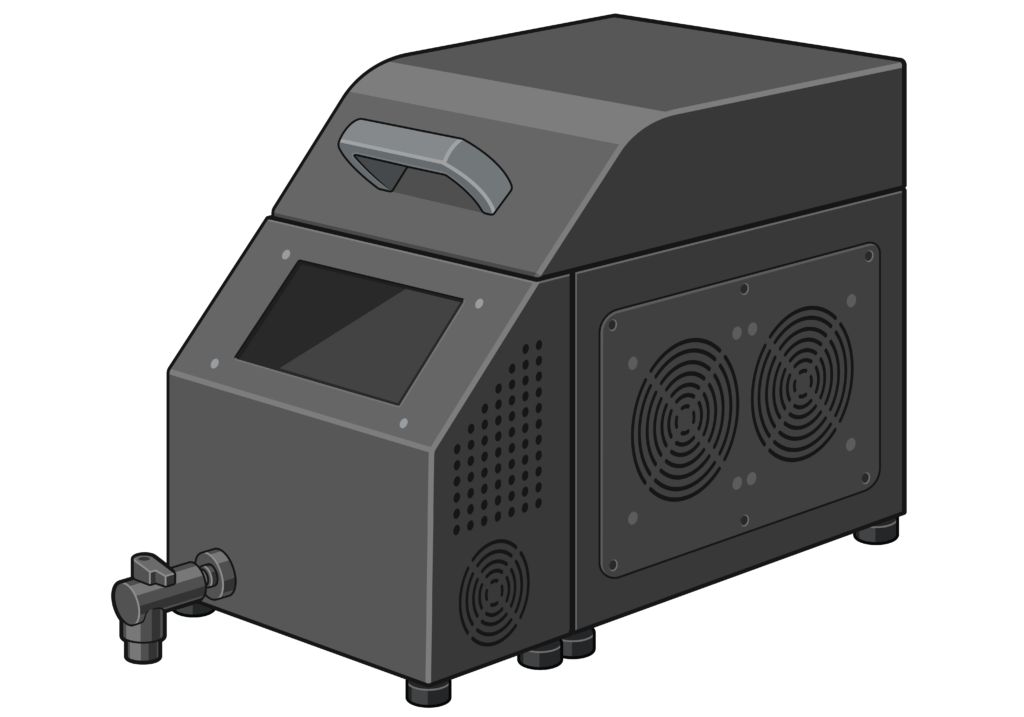
DEVICE CARTOON IMAGES


