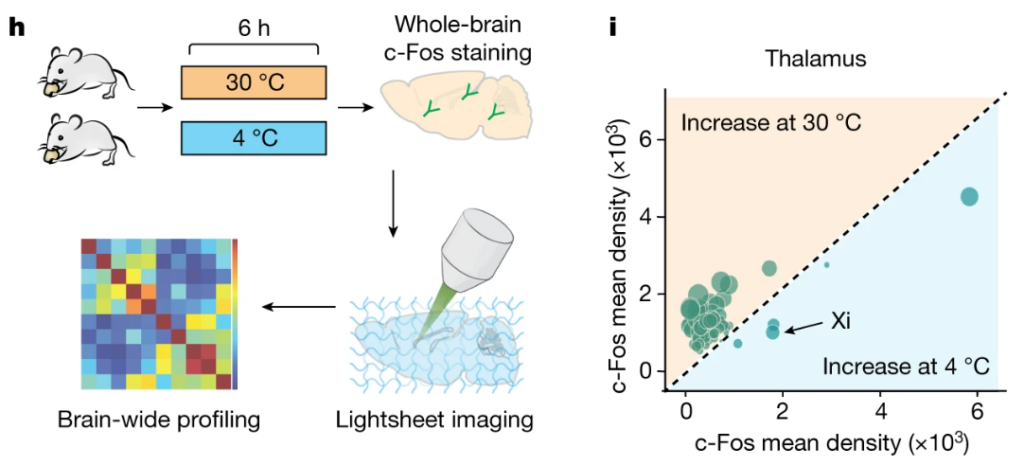
(Ref 2) Figure 1h – 1i: (h) Schematics of whole-brain clearing and volumetric three-dimensional imaging used to identify brain regions activated during cold-induced energy compensations. (i) c-Fos mapping results for the thalamus. Each dot represents c-Fos+ cell count in each distinct region and dot size represents the difference in signal density between the two conditions. Creative Commons Attribution 4.0 International License.
For additional publications supporting this use case refer to: