Map the Spatial Distribution of Proteins and Post-Translational Modifications

Map the Spatial Distribution of Proteins and Post-Translational Modifications

Profile endogenous protein expression patterns across regions to compare baseline protein levels to experimental groups.
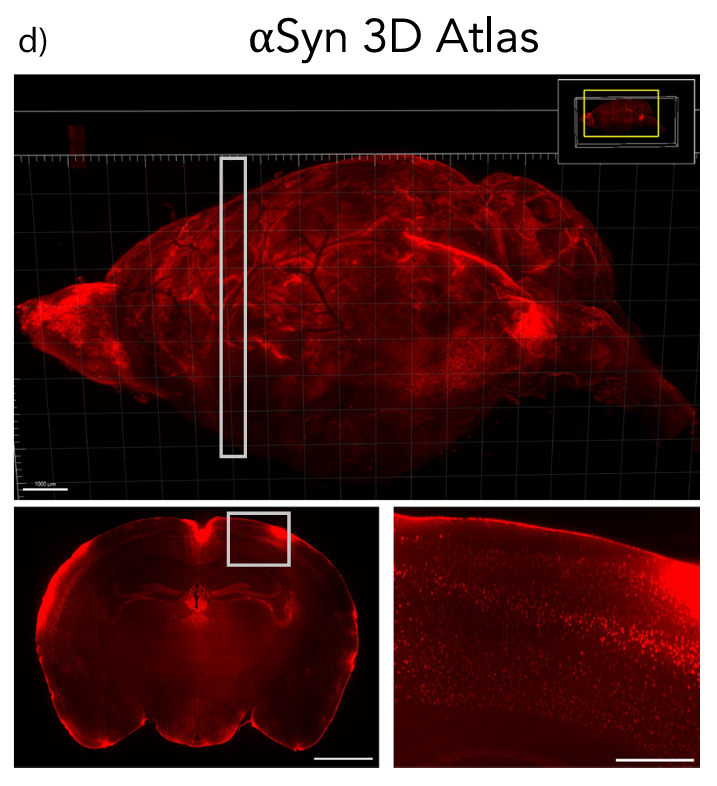
Label genetically expressed, epitope-tagged, wildtype and mutant proteins to visualize their cellular and subcellular distribution in whole tissues and their association with other biological structures.
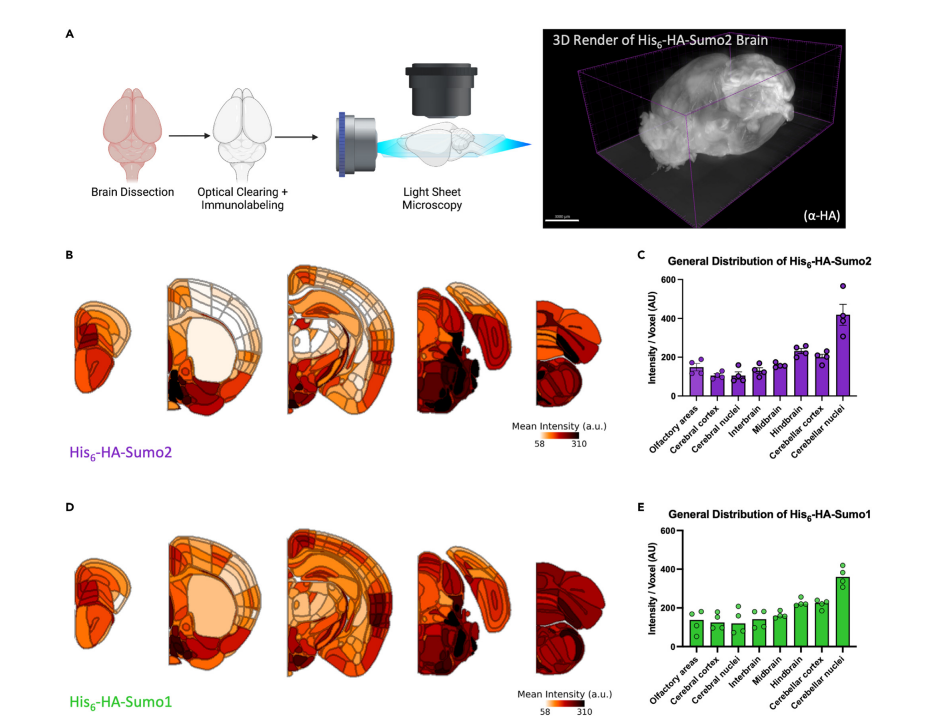
Determine where the regulation of protein activity, localization, and interaction with other biological molecules is taking place within tissues and cells by mapping the cellular and sub-cellular distribution of post-translational modifications.

Figure 2 (Ref 1): Whole-brain imaging reveals the topographical distribution of Sumo paralogs. (A) Schematic of brain clearing and light sheet microscopy for whole brain imaging. Heatmaps and bar plots of Sumo2 (B,C) and Sumo1 (D,E) signal intensity across brain regions. Article distributed under the terms of the Creative Commons CC-BY license.

Video S1 (Ref 1): Imaris 3D render of anti-HA immunosignal in whole His6-HA-Sumo1 brain, related to Figure 2. Scale bar: 3000 μm. Article distributed under the terms of the Creative Commons CC-BY license.

Video S2 (Ref 1): Imaris 3D render of anti-HA immunosignal in whole His6-HA-Sumo2 brain, related to Figure 2. Article distributed under the terms of the Creative Commons CC-BY license.

Figure 1d Geertsma et al. NPJ Parkinson's Disease 10, 65 (2024)

Figure 1d (Ref 2): Representative images of whole brain Flag epitope staining and imaging provide an encompassing view of αSyn topography. White boxes indicate insets. Scale bars: 1000 μm (d top, d bottom left), 250 μm (d bottom right). Article distributed under the terms of the Creative Commons CC-BY license.

Our experienced team of application scientists have protocols to get you to data quickly for validated applications and can propose customized solutions for unvalidated applications.