Neural Activity Mapping | Identify activated neurons and brain regions

Use Case: Identify activated and inhibited brain regions

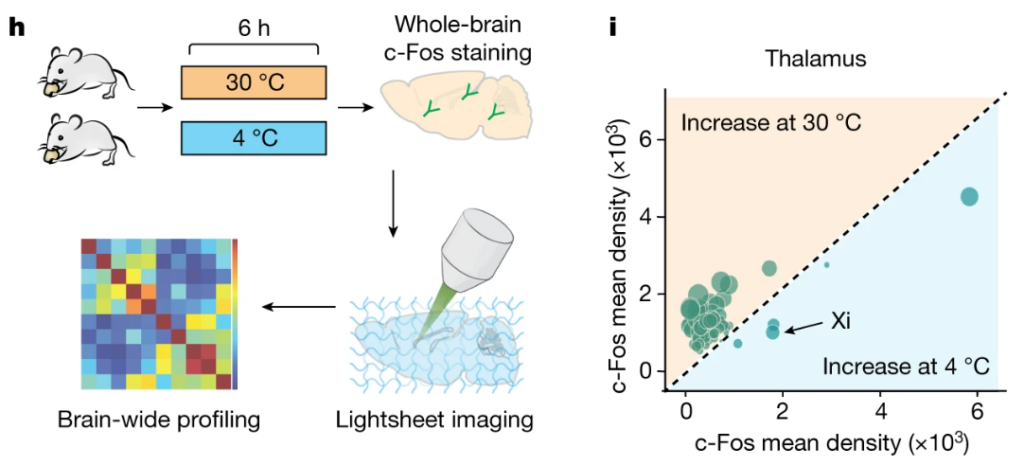
Map whole brain activity: Immunolabeling for cFos, NPAS4, ΔFosB, Arc (excitation) and pPDH (inhibition), imaging at single-cell resolution imaging, and registering automatically to custom brain atlases can reveal regions of brain activity without any a priori knowledge.
Make neural activity comparisons brain-wide: Discover shared and distinct brain activity patterns and neural ensembles across various contexts such as genetic mutations, drug treatments, sexual dimorphisms, homeostatic mechanisms, and more. 
Correlate neural activity with gene expression: Align cFos maps to gene expression maps to identify candidate genes that alter neural activity in distinct brain regions.

Figure 1h – 1i, extracted from Lal, N.K., Le, P., Aggarwal, S. et al. Xiphoid nucleus of the midline thalamus controls cold-induced food seeking. Nature 621, 138–145 (2023). https://doi.org/10.1038/s41586-023-06430-9. Article licensed under the Creative Commons Attribution 4.0 International License.

(h) Schematics of whole-brain clearing and volumetric three-dimensional imaging used to identify brain regions activated during cold-induced energy compensations. (i) c-Fos mapping results for the thalamus. Each dot represents c-Fos+ cell count in each distinct region and dot size represents the difference in signal density between the two conditions.

For additional publications supporting this use case refer to:

Our experienced team of application scientists have protocols to get you to data quickly with validated applications and can propose customized solutions for you for unvalidated applications. Fill the form below to get in touch with someone from the applications team today.

Speak to an expert about your application